Investor relations
I. Company activity
Image Power S.A. operates in the video game market, specialising in the production and distribution of games for desktop computers. The company was set up on June 24, 2016 and launched its activity connected to the gaming industry in 2019. In the same year, the company acquired an important investor, PlayWay S.A., leading video game producer and publisher, listed on the Warsaw Stock Exchange.
The company produces, publishes, and markets games. The company’s products will be sold worldwide via the digital distribution model, mainly through the dedicated distribution platform Steam, the largest distributor of PC games in the world. Apart from that, it will also publish games for consoles such as Nintendo Switch, Xbox One and PlayStation 4.
The driving principle of its activity is the production and distribution of several low and medium-budget and low-margin games. The products are created by scattered small teams of developers, which reduces operation risk thanks to optimal reactions to unexpected random events which may occur during project production. The issuer currently has 4 internal and one external team.
II. Company authorities
BOARD
Marcin Zaleński – Chairman of the Board
He has over 20 years of experience in sales in the commercial sector and financial institutions, as well as over 10 years of experience in building and managing sales teams in the financial and investment sectors. He has been on several boards of commercial law companies. At present, he is also Chairman of the Board of Fundusz Stabilnego Rozwoju sp. z.o.o., of which he is the co-creator and shareholder, and its subsidiary Income Capital sp. z o.o., which, in turn, participated in the creation, development and debut on the Newconnect market of the company Movie Games S.A.
SUPERVISORY BOARD
Rafał Janik – Chairman of Supervisory Board
A graduate of the University of Gdańsk. He has been involved in the video game industry since 2017. In 2019, he defended his PhD thesis with distinction, focusing on the efficient market hypothesis and stock recommendations. He has 15 years of experience in data analysis, business consulting, and company valuation. He runs his own investment risk management firm. Author of books and articles devoted to financial markets. Privately, he is an avid climbing and cycling enthusiast.
Robert Żołędziewski – Member of the Supervisory Board
A certified coach and trainer with over 20 years of experience in supporting managers, sales teams, and executive staff. A graduate of the National Film School in Łódź (PWSFTviT), the University of Information Technology and Management, and IAC Institutes. He has trained more than 8,000 professionals in leadership and interpersonal skills. An academic lecturer who combines a passion for cinema with expertise in coaching and management, effectively supporting the growth of people and organizations.
Robert Ogłodziński-Kolman – Member of the Supervisory Board
Since 2012, he has been involved in the gaming industry — working his way from narrative designer to producer and manager. He holds a degree in Journalism and a postgraduate diploma in Law, Economics, and Management from the University of Warsaw. He has over 20 years of experience in economic journalism. He worked at CD Projekt on The Witcher 3 and Cyberpunk 2077, and has collaborated with several Polish indie studios, including Varsaw Games, Walkabout Games, Polyamorous, Fuero Games, and Warhound. Former Head of Studio at Klabater, and co-founder of Longterm Games, Enjoy Studio, and Rune Powered. He has lectured on journalism and game production at institutions such as the University of Warsaw, Łazarski University, and the Warsaw Film School. Since January 2024, he has been leading the Program Planning Department at the Creative Industries Development Center.
Jakub Trzebiński – Supervisory Board Member
In his career he has written about video games for, among others, magazines CD-ACTION, FILM and LADOS, and portals Polygamia.pl , Stopklatka.pl and Muzyka.pl. He has been working for PlayWay S.A. since 2013, as Vice Chairman since 2016. As COO/CMO in PlayWay S.A. he is responsible for the presence of global brands in Car Mechanic Simulator games, production supervision of games created by PlayWay S.A., media contacts and relations, discovering new developer teams, business contacts and company development, among others.
Marlena Wieteska – Supervisory Board Member
Has 15 years of marketing experience in banks (Citibak, Raiffeisen Bank, FMBank – currently Nest Bank), fintechs (CashDirector S.A., Fair Place Finance S.A.), and digital and advertising agencies (Gamfi, Novem, Garden of Words), 7 years of experience in sales, and 8 years of mentoring experience, including pro bono work for Women Leadership in Business Foundation and AIESEC.
III. Ownership
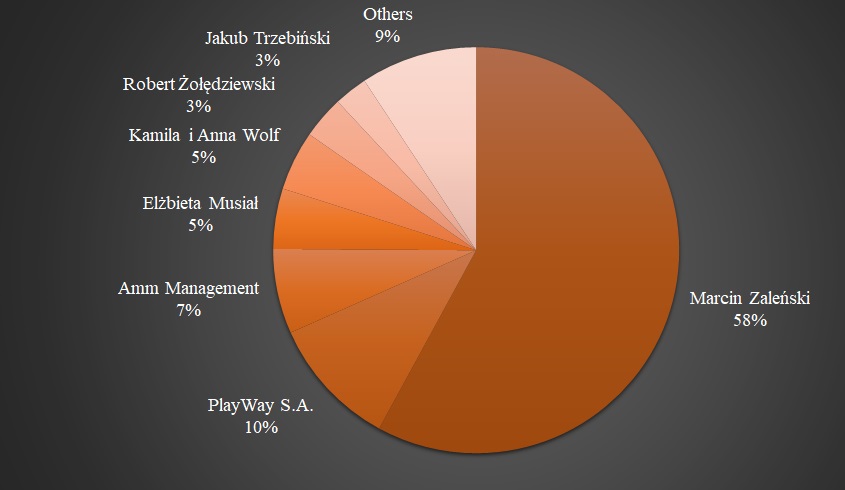
The ownership structure of the Issuer (shares of initial capital and votes in General Meeting) and the list of shareholders owning at least 2% of shares in initial capital and votes in General Meeting of Shareholders are presented below:
Ownership Structure of Issuer (share of initial capital and votes in General Meeting)
| Shareholder | Number of shares | Number of votes | Share of initial capital | Share of total number of votes |
| Marcin Zaleński | 1 871 577 | 1 871 577 | 57,93 | 57,93 |
| PlayWay S.A. | 336 500 | 336 500 | 10,42 | 10,42 |
| Amm Management | 218 000 | 218 000 | 6,75 | 6,75 |
| Elżbieta Musiał | 155 300 | 155 300 | 4,81 | 4,81 |
| Kamila i Anna Wolf | 153 600 | 153 600 | 4,75 | 4,75 |
| Robert Żołędziewski | 110 000 | 110 000 | 3,40 | 3,40 |
| Jakub Trzebiński | 86 000 | 86 000 | 2,66 | 2,66 |
| Others | 299 887 | 299 887 | 9,28 | 9,28 |
| Total | 3 230 864 | 3 230 864 | 100,00 | 100,00 |

IV. Development strategy
In the approved development strategy, the company foresees further development by means of producing and distributing a large number of low and medium-budget, high-margin games. This approach of the Company Board ensures minimal investment risk related to the production of particular games. The development strategy will be implemented through achieving the following goals:
- I. establishing a significant position in the video game secto
- II. diversifying the game range through producing and distributing new projects for PCs and Nintendo Switch – about 5 per year;
- III. further development of intellectual potential through increasing the number of teams and expanding existing ones.
The approved strategy will be implemented by the Issuer throughout 2021 and 2022. In order to implement the development strategy, the Company is considering using funds from company operations, i.e., funds from games sales, funds acquired from publishers and funds issued from co-creating smaller projects.
V. Income structure
The Issuer’s net sales structure by type in 2020 and 2021 (in Polish zloty) is as follows:
| Detailed list | 2020 | 2021 |
| Income from product sales | 127 781,29 | 47 510,63 |
| Change in the balance of products (increase – positive value, decrease – negative value) | 787 396,14 | 1 183 015,07 |
| Net income from sales and equivalent income | 915 177,43 | 1 230 525,70 |
VI. Financial results
| Detailed list | 2020 | 2021 |
| Net sales income | 915 177,43 | 1 230 525,70 |
| Sales profit | -405 542,50 | -496 911,85 |
| Depreciation | 40 000,00 | 22 916,67 |
| EBIT | -410 625,07 | -498 339,22 |
| Net profit | -413 999,10 | -496 139,89 |
| Fixed assets | 22 916,67 | 0,00 |
| Current assets | 2 461 812,00 | 2 393 726,68 |
| Inventory | 787 396,14 | 1 970 411,21 |
| Short-term receivables | 146 965,00 | 116 720,17 |
| Cash | 1 527 450,86 | 291 885,03 |
| Own capital | 2 418 578,23 | 1 922 438,34 |
| Liabilities and provisions for liabilities | 66 150,44 | 471 288,34 |
| Short-term liabilities | 66 150,44 | 71 007,00 |
| Balance sheet total | 2 484 728,67 | 2 393 726,68 |
VII. Business operating environment
Global video game market
Graph 1 Global video game market value in 2019 and forecast for 2020-2023 ($ bn)

P – forecast
Source: Global Games Market Report, Newzoo, 2020 and the report “Kondycja Polskiej Branży Gier 2020” (“The State of the Polish Games Industry in 2020”)
In terms of income, all game segments have seen an increase due to the COVID-19 pandemic, yet it is mobile games that have stood out as leaders. The forecast indicates that in 2020 mobile games will generate $86.3bn worth of revenue, which means a year-on-year increase of 25.6 %. This is also the segment which comes first when it comes to revenue among applications. Newzoo specialists quote several important arguments to suggest that mobile games are going to develop much faster than PC or console games. First and foremost, mobile games have the lowest entry barriers of all segments, as over 40% of the global population have smartphones, many mobile products are available free of charge, and the process of developing mobile devices is less complex. According to American research agency eMarketer, in 2016, in the United States alone as many as 180.4m people (70% of owners of mobile devices and 56% of the country’s population) played games on their phones. This number may reach 213m in 2020.[1]
The segment which is second in size are consoles, with a market share expected to remain for the next three years at an approximate level of 30%. The value of the segment in 2020 is estimated at $51.2bn, with over 729 million players, and the estimated value of the CAGR throughout 2019-2022 is predicted to be 9.7%. Physical distribution, mass cooperation between companies and certification are the main elements of creating console games, which may however lead to future delays or reducing the range and axing the functions of games which will reach distribution channels, all due to COVID-19. The share of computer games in market revenue is going to decrease, with a fall from 22% to 19% forecast for 2018-2023, even though the CAGR is forecast at 4.8%. In 2020 the global PC games market, driven by 1.3bn players, is going to grow and reach $37.4bn. The share of browser games in the video game market will see a decrease from 3% in 2018 to 1% in 2023. This is reflected in the estimated CAGR level, which in the above-mentioned period is going to stand at ca. -17.0%.[2]
Graph 2 Estimation of income for the global game market for 2020 by platform (bn $ and %)

Source: Global Games Market Report, Newzoo, 2020 and the report “Kondycja Polskiej Branży Gier 2020” (“The State of the Polish Games Industry in 2020”)
In terms of geography, Asia and Pacific is going to be the most profitable region for the video game industry in 2020, generating $84.3bn, or 48 % of the total global income from games. North America comes in second (26%), Europe third (19%), Latin America fourth, and the Near East and Africa fifth (3%). In the next three years, the fastest developing region in terms of game income is going to be India and South East Asia. The Chinese and US markets alone are due to represent 49% of all global consumer spending on games in 2020.
Graph 3 Share of global regions in video game market structure in 2020.

Source: Global Games Market Report, Newzoo, 2020 and the report “Kondycja Polskiej Branży Gier 2020” (“The State of the Polish Games Industry in 2020”)
According to Newzoo, in 2020 the largest game market is going to be China, with a market value of $44bn. A slightly lower income of $41.3bn is going to be generated by the US. [3] Japan is expected to come third in terms of market size, with the value fluctuating around $18.68bn. Estimates for 2020 point to Germany as the largest gaming market in Europe, worth $5.965bn. The Eastern Europe region, which also includes the Polish market, has reached an income of $3.9bn with an annual growth rate of +9.1%. It has been growing at almost double the rate of the mature gaming market of Western Europe. In Eastern Europe Russia is responsible for $1.65bn, and Poland for $579m with a considerable year-on-year increase of 11%. According to Newzoo, in 2019 the value of the Polish game industry surpassed $596m, and the forecast prepared by the authors of the report . “Kondycja Polskiej Branży Gier 2017” (“The State of the Polish Games Industry in 2017”) from Polish Gamers Observatory for 2019 was close to the Newzoo estimates, with PLN 2.23bn, or $586m.
According to Newzoo, by the end of 2020, there will be over 2.68bn active players worldwide, the majority of which, 54%(1.447bn) will come from the Asia Pacific Region, Europe (386m) and Africa and the Near East (377m), representing respectively around 18% of the player population. Similar estimates have been presented by analysts from statista.com, who claim that by 2021 the number of players worldwide will rise to 2.67bn, which means an average year-on-year increase of 7.3% between 2014 and 2021. However, it is important to bear in mind that the rise in new player numbers or the reactivation of former users, triggered by the COVID-19 pandemic, might not be sustained after incidental gamers return to their regular habits or the financial situation of individual players in poorer or developing countries deteriorates.
Graph 4 Number of active video game player between 2016 and 2019 and estimated number between 2020 and 2023 (in bn)

P – forecast
Source: Global Games Market Report, Newzoo, 2020 and the report “Kondycja Polskiej Branży Gier 2020” (“The State of the Polish Games Industry in 2020”)
Polish video game market
Graph 5 The value of the Polish game market for consumer-generated income in 2019 and forecast for 2020-2024 (in bn PLN)

P – forecast
Source: report “Kondycja Polskiej Branży Gier 2020” (“The State of the Polish Games Industry in 2020”)
In 2020 the largest share in Polish game market revenue will be that of mobile games, which will surpass PLN 1bn, seeing a year-on-year increase of 12%. Their present share in comparison to other types of games in the Polish market is 44%, which is expected to rise to 53% by 2024. The second segment important in terms of revenue will be games available for personal computers, both box/digital versions and browser versions, whose result will reach PLN 770m. It is worth noting that a large part of the share of browser games in the market will be replaced by mobile games. There will be a decrease of approximately 13% in favour of smartphones. Console games will maintain their stable market share at 25% and in 2020 they will be valued at PLN 620m.
As for gaming platforms in Poland, ever since 2016 the most popular platform is that of mobile devices such as smartphones or tablets. In 2020, as many as 50% of gamers declared smartphones to be one of their sources of gaming entertainment. The runners-up are, on equal terms, games for personal computers and laptops and social media games – 31 % respectively. Third and fourth are PC browser games (24%) and console games (22%).
The most popular shopping platform among PC players is still Steam (38%). It owes its popularity largely to its long-term presence in the Polish market and numerous special offers that Poles are keen to use. Origin, indicated by 13% of the surveyed, came in second. Slightly less popular are auction websites, such as Allegro, eBay or OLX (12%). Microsoft Store and Epic Game Store were mentioned by 6% of the surveyed. Much less popular are domestic platforms for trading electronic game versions, such as G2A, Uplay and Kinguina. Surveys also suggest that a significant 57% of gamers download free games from the internet. What is more, traditional game distribution still has more fans, i.e. 46%, while 40% prefer digital distribution.
VIII. Raporty
Raporty EBI
Raporty okresowe
IX. Prezentacje
X. Notowania
XI. Dokument informacyjny
XII. Kalendarium
Zarząd Spółki Image Power S.A. z siedzibą w Warszawie (dalej jako: Spółka) podaje do publicznej wiadomości harmonogram publikacji raportów okresowych Spółki w roku 2021, zgodnie z którym:
– raport roczny za rok 2020 zostanie opublikowany w dniu 19 kwietnia 2021 r.,
– raport kwartalny za I kwartał 2021 r. zostanie opublikowany w dniu 10 maja 2021 r.,
– raport kwartalny za II kwartał 2021 r. zostanie opublikowany w dniu 10 sierpnia 2021 r.,
– raport kwartalny za III kwartał 2021 r. zostanie opublikowany w dniu 10 listopada 2021 r.
Ewentualne zmiany dat przekazywania poszczególnych raportów okresowych zostaną podane do wiadomości publicznej w formie raportu bieżącego.
XIII. Ład korporacyjny
XIV. Walne Zgromadzenie
XV. Dane kontaktowe
Kontakt dla inwestorów: marcin@imagepower.pl – Marcin Zaleński (Chairman of the Board)
ul. Nyska 87/51
50-505 Wrocław
tel: (+48) 71 307 36 24
fax: (+48) 71 719 91 55
email: info@blueoak.pl
www.blueoak.pl
Plac Unii, Budynek B
ul. Puławska 2
02-566 Warszawa
tel. (+48) 22 330 11 11
www.trigon.pl/
